| Task type | Total in year 2026 | Total in year 2025 | Total in year 2024 | Total in year 2023 | Total in year 2022 | Total in year 2021 | Total in year 2020 | Total in year 2019 | Total in year 2018 | Total in year 2017 | Total in year 2016 | Total in year 2015 | Total across years |
|---|---|---|---|---|---|---|---|---|---|---|---|---|---|
| Timelines page update | 0.00 | 0.00 | 0.00 | 0.00 | 0.00 | 3,620.00 | 0.00 | 0.00 | 0.00 | 0.00 | 0.00 | 0.00 | 3,620.00 |
| Preliminary research | 0.00 | 0.00 | 0.00 | 0.00 | 0.00 | 0.00 | 0.00 | 0.00 | 0.00 | 0.00 | 170.00 | 0.00 | 170.00 |
| Total | 0.00 | 0.00 | 0.00 | 0.00 | 0.00 | 3,620.00 | 0.00 | 0.00 | 0.00 | 0.00 | 170.00 | 0.00 | 3,790.00 |
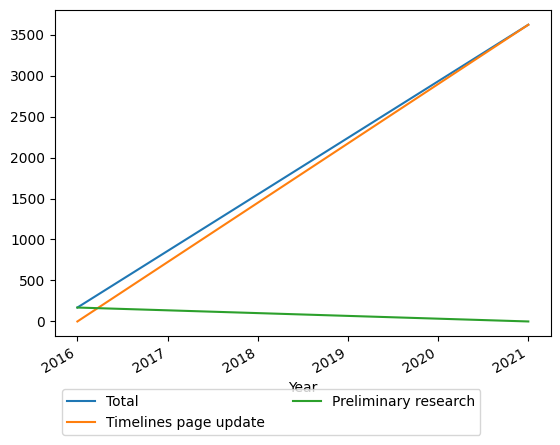
Graph of payments made by task type and year (incremental, not cumulative)

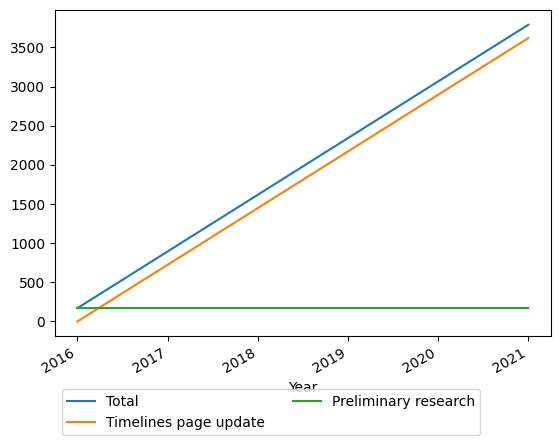
Graph of payments made by task type and year (cumulative)

| Month | Timelines page update | Preliminary research | Total across task types |
|---|---|---|---|
| 2021-12 | 208.00 | 0.00 | 208.00 |
| 2021-10 | 380.00 | 0.00 | 380.00 |
| 2021-07 | 22.00 | 0.00 | 22.00 |
| 2021-06 | 379.00 | 0.00 | 379.00 |
| 2021-04 | 1,169.00 | 0.00 | 1,169.00 |
| 2021-03 | 1,059.00 | 0.00 | 1,059.00 |
| 2021-02 | 403.00 | 0.00 | 403.00 |
| 2016-12 | 0.00 | 170.00 | 170.00 |
| Total across months | 3,620.00 | 170.00 | 3,790.00 |
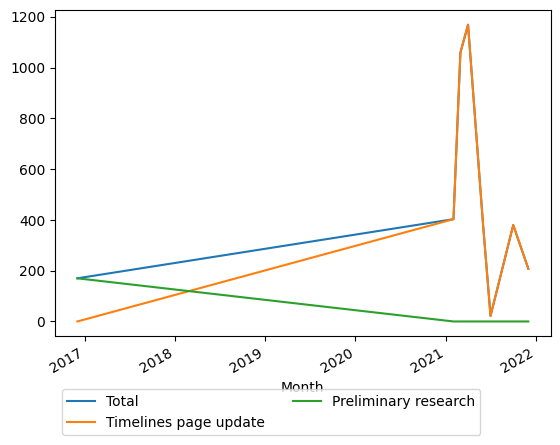
Graph of payments made by task type and year (incremental, not cumulative)

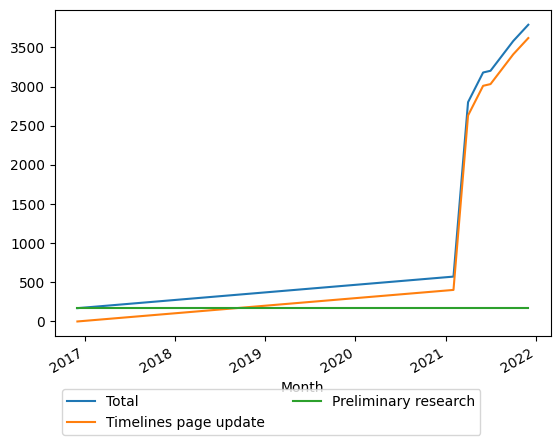
Graph of payments made by task type and year (cumulative)

| Worker | Task venue | Task type | Task receptacle | Completion date | Payer | Payment | Topic | Time spent (hours:minutes) | Effective pay per hour | Notes |
|---|---|---|---|---|---|---|---|---|---|---|
| Sebastian Sanchez | Timelines wiki | Timelines page update | Multiple pages | 2021-12-31 | Vipul Naik | 208.00 | Graphs | Google Scholar table and chart additions for 52 timelines at about $4 / timeline | ||
| Sebastian Sanchez | Timelines wiki | Timelines page update | Multiple pages | 2021-10-31 | Vipul Naik | 40.00 | Graphs | 12 charts across 4 timelines at $3.33 / timeline: decision theory, Ebola virus disease, e-commerce, and economic statistics | ||
| Sebastian Sanchez | Timelines wiki | Timelines page update | Multiple pages | 2021-10-31 | Vipul Naik | 340.00 | Graphs | Google Scholar table and chart additions for 85 timelines at about $4 / timeline | ||
| Sebastian Sanchez | Timelines wiki | Timelines page update | Multiple pages | 2021-07-31 | Vipul Naik | 22.00 | Graphs | Graph fixes/remakes at $4 / graph for Google Scholar for three timelines (AlphaGo, Bitcoin, and digital preservation), and 3 graphs added to timeline of Chagas disease | ||
| Sebastian Sanchez | Timelines wiki | Timelines page update | Multiple pages | 2021-06-30 | Vipul Naik | 356.00 | Graphs | Google Scholar table and chart additions for 89 timelines at about $4 / timeline | ||
| Sebastian Sanchez | Timelines wiki | Timelines page update | Multiple pages | 2021-06-04 | Vipul Naik | 23.00 | Graphs | 7 graphs across 2 timelines at about $3.33 / timelines | ||
| Sebastian Sanchez | Timelines wiki | Timelines page update | Multiple pages | 2021-04-30 | Vipul Naik | 1,169.00 | Graphs | 351 graphs across several timelines at about $3.33 / graph | ||
| Sebastian Sanchez | Timelines wiki | Timelines page update | Multiple pages | 2021-03-31 | Vipul Naik | 1,059.00 | Graphs | 318 graphs across several timelines at about $3.33 / graph | ||
| Sebastian Sanchez | Timelines wiki | Timelines page update | Multiple pages | 2021-02-06 | Vipul Naik | 403.00 | Graphs | 121 graphs across 41 timelines (A to C) at about $3.33 / graph | ||
| Issa Rice | wikiHow | Preliminary research | Optimize Your Amazon S3 Costs | 2016-12-03 | Vipul Naik | 170.00 | Amazon Web Services | Investigated comparison of different cost plans by Amazon and when each one is optimal |