| Task type | Total across years | Total in year 2023 | Total in year 2021 | Total in year 2019 | Total in year 2018 |
|---|---|---|---|---|---|
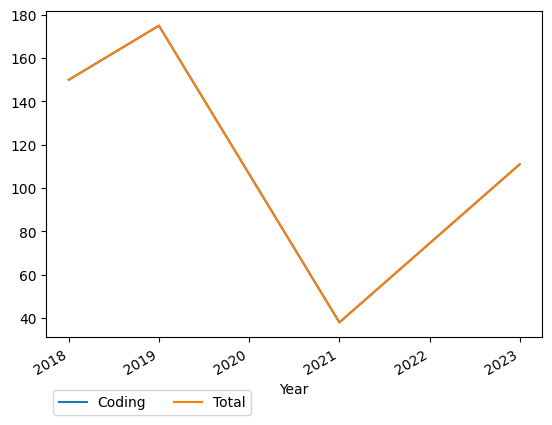
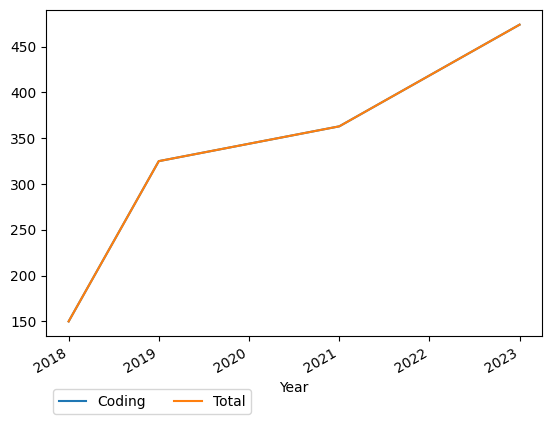
| Coding | 474.02 | 111.02 | 38.00 | 175.00 | 150.00 |
| Total | 474.02 | 111.02 | 38.00 | 175.00 | 150.00 |
Graph of task payments due by type and year (incremental, not cumulative)
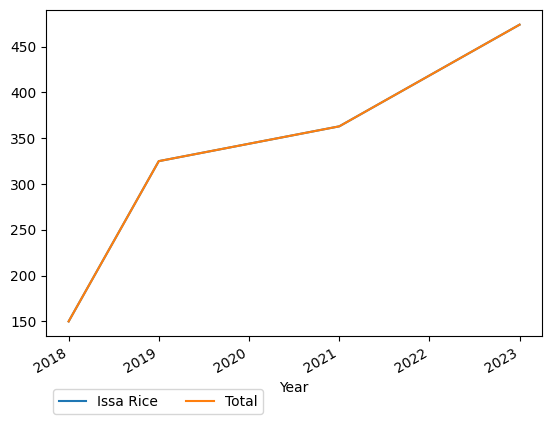
Graph of task payments due by type and year (cumulative)
| Task payer | Total across years | Total in year 2023 | Total in year 2021 | Total in year 2019 | Total in year 2018 |
|---|---|---|---|---|---|
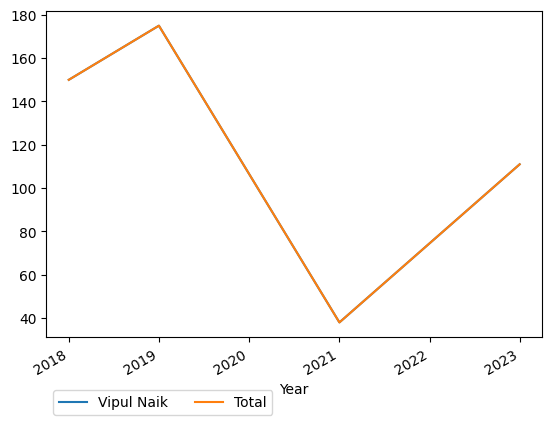
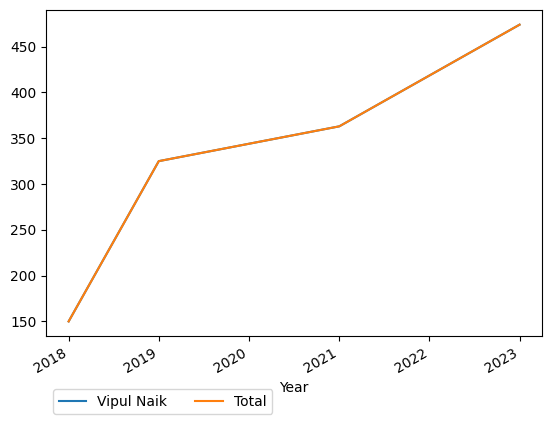
| Vipul Naik | 474.02 | 111.02 | 38.00 | 175.00 | 150.00 |
| Total | 474.02 | 111.02 | 38.00 | 175.00 | 150.00 |
Graph of task payments due by payer and year (incremental, not cumulative)
Graph of task payments due by payer and year (cumulative)
| Task worker | Total across years | Total in year 2023 | Total in year 2021 | Total in year 2019 | Total in year 2018 |
|---|---|---|---|---|---|
| Issa Rice | 474.02 | 111.02 | 38.00 | 175.00 | 150.00 |
| Total | 474.02 | 111.02 | 38.00 | 175.00 | 150.00 |
Graph of task payments due by worker and year (incremental, not cumulative)

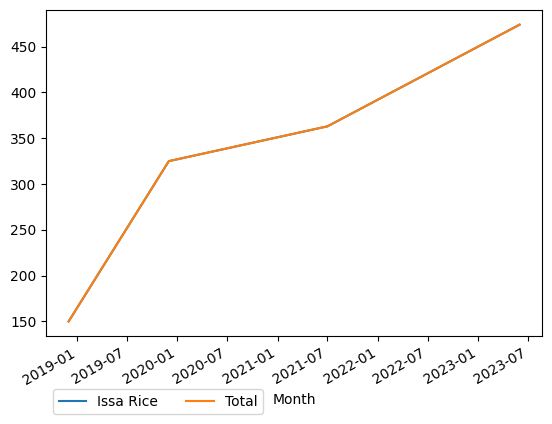
Graph of task payments due by worker and year (cumulative)
| Month | Total across task types | Coding |
|---|---|---|
| 2023-06 | 111.02 | 111.02 |
| 2021-07 | 38.00 | 38.00 |
| 2019-12 | 175.00 | 175.00 |
| 2018-12 | 150.00 | 150.00 |
| Total across months | 474.02 | 474.02 |
Graph of task payments due by type and month (incremental, not cumulative)
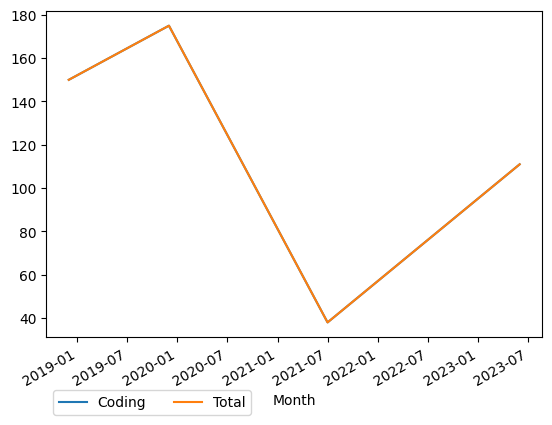
Graph of task payments due by type and month (cumulative)

| Month | Total across task payers | Vipul Naik |
|---|---|---|
| 2023-06 | 111.02 | 111.02 |
| 2021-07 | 38.00 | 38.00 |
| 2019-12 | 175.00 | 175.00 |
| 2018-12 | 150.00 | 150.00 |
| Total across months | 474.02 | 474.02 |
Graph of task payments due by payer and month (incremental, not cumulative)
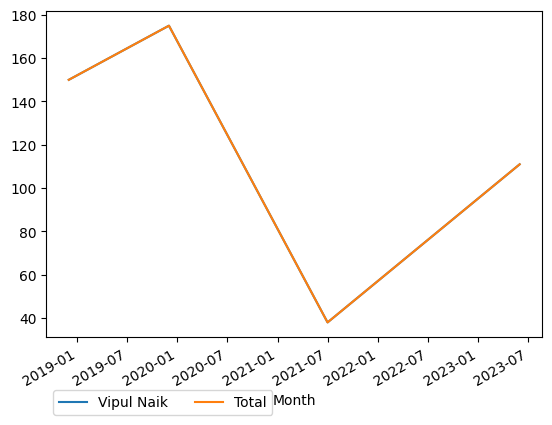
Graph of task payments due by payer and month (cumulative)

| Month | Total across task workers | Issa Rice |
|---|---|---|
| 2023-06 | 111.02 | 111.02 |
| 2021-07 | 38.00 | 38.00 |
| 2019-12 | 175.00 | 175.00 |
| 2018-12 | 150.00 | 150.00 |
| Total across months | 474.02 | 474.02 |
Graph of task payments due by worker and month (incremental, not cumulative)
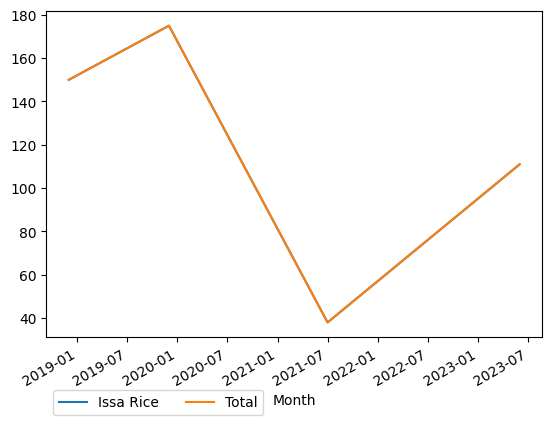
Graph of task payments due by worker and month (cumulative)
| Worker | Task type | Task receptacle | Completion date | Payer | Payment | Topic | Format | Time spent (hours:minutes) | Effective pay per hour | Notes |
|---|---|---|---|---|---|---|---|---|---|---|
| Issa Rice | Coding | Switch analytics projects to GA 4 | 2023-06-25 | Vipul Naik | 111.02 | Analytics | Code | 7:29 | 14.84 | Spent 449 minutes at $11.50/hour with a 5-hour minimum, plus $25. Work done 2023-05-21 to 2023-05-22 and 2023-06-21 to 2023-06-25. See https://github.com/riceissa/analytics-table/commits?since=2023-05-21&until=2023-06-25&author=riceissa for the commits. |
| Issa Rice | Coding | On top-pages.php, print the h-index for every month | 2021-07-10 | Vipul Naik | 38.00 | Analytics | Code | 0:47 | 48.51 | Work done 2021-07-10. Payment at max($38, $9.50/hour * time spent). |
| Issa Rice | Coding | analytics.vipulnaik.com | 2019-12-15 | Vipul Naik | 175.00 | Analytics | Code | 20:06 | 8.71 | Work done from October 25 to December 15, 2019. The work was on issues https://github.com/riceissa/analytics-table/issues/2 https://github.com/riceissa/analytics-table/issues/3 https://github.com/riceissa/analytics-table/issues/4 https://github.com/riceissa/analytics-table/issues/5 and https://github.com/riceissa/analytics-table/issues/6 of which the bulk of effort was on the last issue; this makes available the top viewed pages by month for each site. Payment calculated as max($175, 20.10 hours * $8.50/hour) |
| Issa Rice | Coding | analytics.vipulnaik.com | 2018-12-15 | Vipul Naik | 150.00 | Analytics | Code and data | 12:55 | 11.61 | Setup work for a public website https://analytics.vipulnaik.com that records Google Analytics data for a number of websites. Pay for this was set as max{$150, $8.50/hour * Time spent}. 12.92 hours were spent on the first phase of work, so the $150 was binding. Work done 2018-11-26 to 2018-12-15. GitHub repository at https://github.com/riceissa/analytics-table |